Welcome to Excel Jet Consult blog post. In this tutorial, we are going to learn how to sum values using DAX DATESBETWEEN function in Power BI as well as using SUMIFS in Excel. Let’s get started
DATESBETWEEN returns a table that contains a column of dates that begins with the start_date and continues to the end_date
DATESBETWEEN Syntax =DATESBETWEEN(dates, start_date, end_date)
Note, if start_date is a blank date value, then start_date will be the earliest value in the dates column
If the end_date is a blank date value, then end_date will be the latest value in the dates column
Summing Values Between Two Dates In Excel
In the caption below, we have the data we are going to use in Excel and Power BI to achieve the same result at the end


Note, we are going to calculate Total sales Between 20/02/2015 & 20/02/2016 for Account Managers
In cell B2 of Sheet1, execute the formula:
=SUMIFS(Total,Account_Manager,A2,Order_Date,”>=”&$D$1,Order_Date,”<=”&$D$2)
Copy down the formula


In the caption above, we used SUMIFS function and named range
Total is the named range representing the sum_range
Account Manager named range is the criteria_range1
A2 is the cell reference for criteria1
Order_date is the criteria_range2 named range
“>=”&$D$1 is the criteria2
Order_date is the criteria_range3 named range
“<=”&$D$2 is the criteria3
Summing Values Between Two Dates In Power BI
In the captions below, we have the same data loaded to the Data Model and very importantly, we have created Date Table which enables us to use the Time Intelligence DAX function such as DATESBETWEEN that we are going to use. Furthermore, we have established one-to-many relationship between the fact table and the time intelligence dimension table


The fact table name is Fact_Transaction_tbl while the Date dimension table name is Time Intelligence Date as seen in the relationship caption above
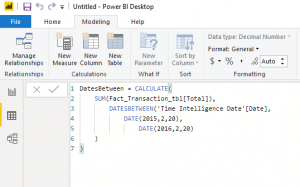
In the Calculations group of the Modelling tab, click on New Measure
In the formula bar, execute the following:
DatesBetween = CALCULATE(SUM(Fact_Transaction_tbl[Total]),DATESBETWEEN(‘Time Intelligence Date'[Date],DATE(2015,2,20),DATE(2016,2,20)))
In the above DAX formula:
SUM(Fact_Transaction_tbl[Total] – adds up all the values in the Total column of the Fact Table
DATESBETWEEN(‘Time Intelligence Date'[Date] – the referenced Table and Column names
DATE(2015,2,20) – start date
DATE(2016,2,20) – end date
I wrapped all the formula inside the CALCULATE function


In the Report view: Click on Table visualization
Drag and drop Account Manager and DatesBetween Measure inside the Values
Then, I sorted the Account Manager in ascending order


We got the same result for Excel and Power BI

How would you do this in Power BI if its a dynamic date range from (2 columns) which are in the same row as the Value you wish to Sum in the fact transaction table?
Also interested to know how you would do this with a dynamic date range as described by Tyler.